Asset allocation update: warning lights are flashing Multi-asset | October 2021

Insights

Asset allocation update: warning lights are flashing Multi-asset | October 2021

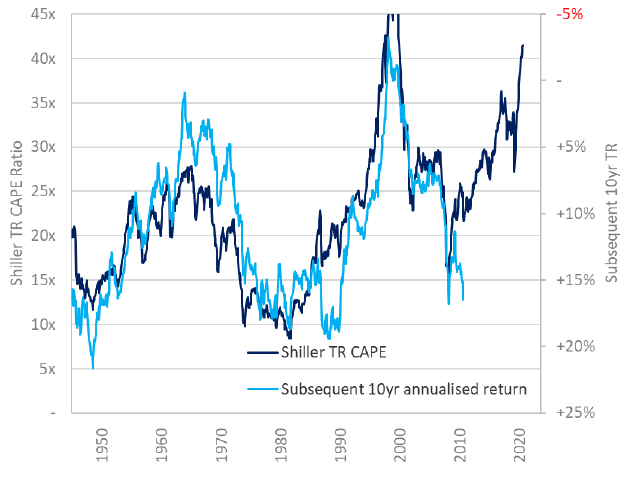
After 18 months of exceptionally strong equity markets, most measures of valuations look high against their own absolute histories. The measure most favoured among long-time equity bears over the past decade or so has been the Shiller Cyclically-Adjusted Price Earnings (CAPE) ratio. I’m not a great fan of this measure as it has a nasty habit of jumping around without prices actually changing, but it takes a 10-year rolling time window of earnings and divides their sum by today’s price. As such it has a habit or lurching down – signalling better valuations – when a recession recedes just beyond the decade-ago mark.
Putting stock in such a backward-looking measure appears curious. But there is no denying how good this has been in defining the ballpark for subsequent 10-year returns: see the light blue line, right-hand inverse axis of Figure 1. The Shiller Total Return CAPE is at levels only seen in the post-war era during the dotcom boom. Warning lights are flashing!
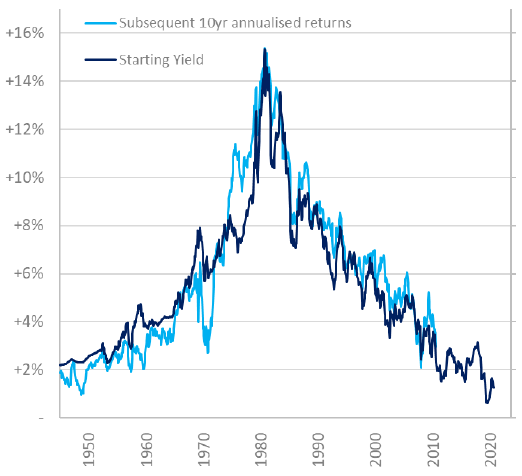
Figures 1 & 2: Shiller total return CAPE ratio vs annual returns; 10-year US Treasury yields vs annual returns
Figure 1
Shiller Total Return CAPE Ratio im Vergleich zu den jährlichen Renditen
Figure 2
Ratio CAPE de Shiller ajusté en fonction de la performance totale par rapport aux performances annuelles
Source: Yale University, Bloomberg, Columbia Threadneedle, October 2021
But equities are not valued in a vacuum. More impressive than the fit between absolute equity valuations and subsequent returns – and ridiculously less surprising – is the fit between bond yields and subsequent returns (Figure 2). Because, while equities offer a woolly promise about participating in the future growth of the economy, all that bonds promise is to pay their coupon. And the promise today is for very low returns. So to what extent is the low-yield environment making equities look rich in absolute terms?

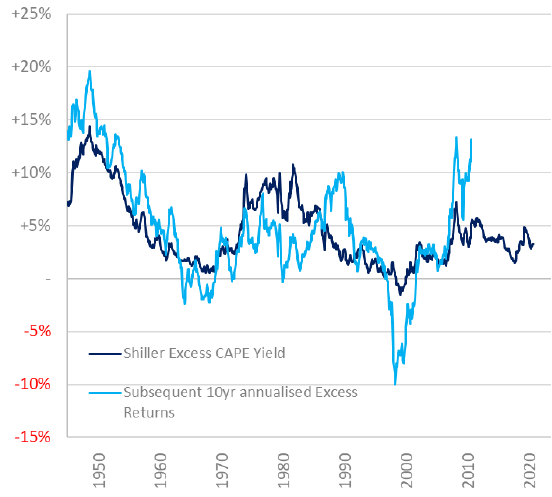
Pulling the bond and equity sides together, we can look at the excess yield that an inverse CAPE ratio – ie, the cyclically-adjusted earnings yield – offers in excess of US Treasuries. The way that this relates to subsequent 10-year returns in Figure 3 looks sketchier than Figure 1. Moreover, it doesn’t explain some of the wild swings – the period that captures investing at the height of the dotcom boom and cashing out in the depths of the global financial crisis, or the post-GFC boom that captures investing in the depths of the GFC itself and cashing out around now. But I don’t think it is an unreasonable way to think about the impact of valuation on longish-term return horizons. Through this lens, excess returns “promised” by equities versus bonds are middling-to-attractive. But on a low absolute bond base.

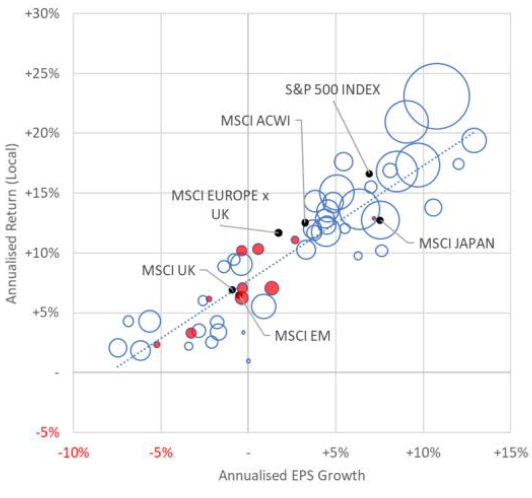
Figures 3 & 4: Shiller earnings-to-price ratio vs annual returns; annualised change in 12-month forward consensus EPS vs annualised regional returns
Figure 3
Toby Nangle AA update October 2021
Figure 4
Toby Nangle AA update October 2021
Source: Yale University, Bloomberg, Columbia Threadneedle, October 2021. Figure 3 shows Shiller total return cyclically adjusted earnings to price ratio and 10-year subsequent annualised returns since 1945; Figure 4 shows the annualised change in 12-month forward consensus EPS vs. annualised return for region/sector cohorts of the MSCI All Country World equity index, 10 years to September 30 2021.
It is evidently true that the starting valuation of an investment is an important determinant of subsequent returns – but equity returns are defined by more than their starting valuation. This can be seen in Figure 4, which relates 10-year period returns on the vertical axis to 10-year cumulative (12-month forward estimated) earnings growth on the horizontal axis through September 2021.
Each bubble in Figure 4 represents a region-sector cohort of the MSCI All Country World Index, sized by the proportion that this region/sector represents of the global equity market. For example, the biggest bubble on the chart in the top right is the US technology sector. This sector is the largest part of the global equity market at close to 19% of the MSCI ACWI market value and as such it is represented as the largest bubble. US technology as a whole saw an annualised growth in forward earnings expectations of 11% per annum (shown on the horizontal axis) and an annualised total return of 23% per annum (shown on the vertical axis).
The relationship between changes in estimated one-year forward earnings and total returns is not perfect; if it was there would be no scope for valuation or changes in valuation to play a role in market returns. Nor would there be any scope for changes in the estimated earning potential beyond a 12-month horizon in the prices paid for firms. Despite these caveats, the relationship is strong, suggesting that the perceived evolution of firms’ earnings potential is an important driver in the variation of returns for equities.
I have shaded in red the sector bubbles relating to UK equities to illustrate how, while underperforming other markets substantially over the period, UK equities did around as well as they might have been expected to do with perfect foresight of their earnings trajectory. I infer from this that, while aggregate starting valuation is important (heuristically informing the intercept on the chart), the pace of medium-term earnings growth is still very important in informing equity returns.

Where does that leave us today?

Bond yields are low, but most measures of risk premia that relate equities to bonds suggest investors are well-compensated for taking equity risk. Our expectations for earnings growth over the next 12-24 months is strong, and as such equities look attractive despite the lofty absolute valuations.
Where could we come unstuck? There are two main threats, one on the earnings side and the other on the valuation side. The supply disruptions and spikes in input costs are making for a very challenging environment for businesses to deliver earnings in line with our expectations. I was struck speaking with Columbia Threadneedle Investments equity analysts and managers as to the degree to which individual firms sitting in the same sector and facing the same challenges are faring. Rather than it being as a result of changes in their end demand, these companies’ near-term earnings results seem largely a function of hedging strategies that different management teams deploy; their ability to source key components; the way in which they navigate challenges in employment markets; and their end-market pricing power. These are not areas for which macro investors are well equipped to add value, and so it is of great comfort to have so many excellent colleagues engaging with management teams around the world.
On the valuation side, if the bond anchor is dislodged and yields trade substantially higher, the excess risk premia that equities offer could be diminished. This informs our analysis around the inflationary environment where we continue to believe measures of inflation will rise in the short term but will moderate rapidly in 2022. The risks are real, but it is my judgement that equity investors are being paid for them.
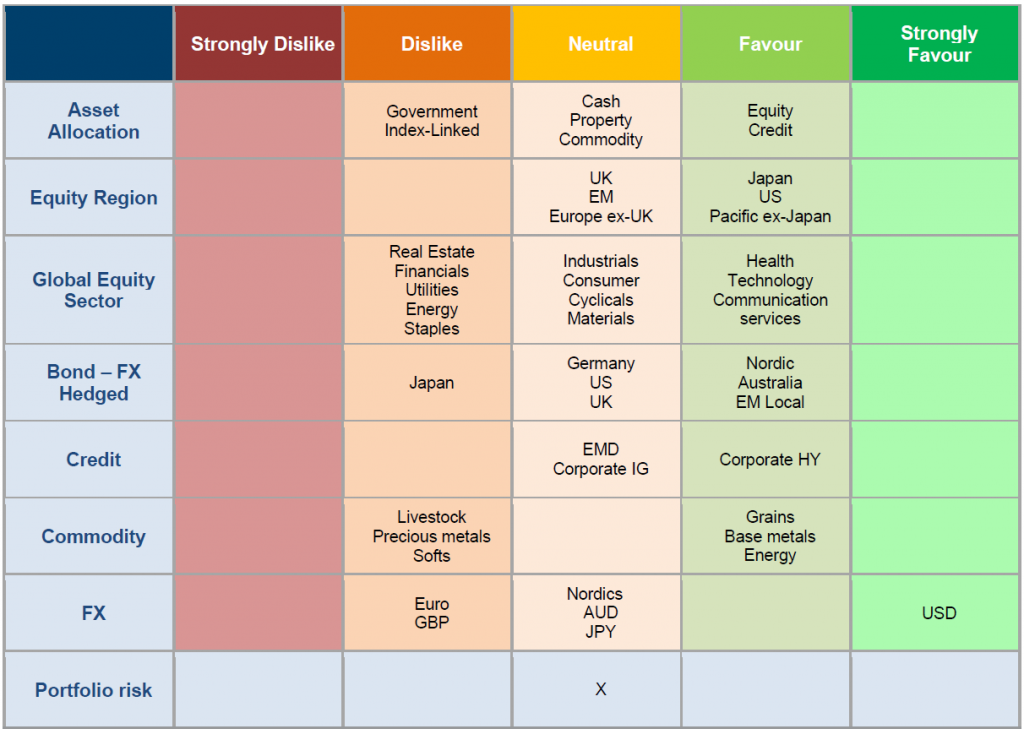
Figure 5: Asset allocation snapshot
Asset allocation snapshot
Source: Columbia Threadneedle Investment, 18 October 2021.
22 October 2021
Toby Nangle
Toby Nangle
Global Head of Asset Allocation & Head of Multi-Asset, EMEA
Share article
Key topics
Related topics
Listen on Stitcher badge
Share article
Key topics
Related topics

PDF

Asset allocation update: warning lights are flashing Multi-asset | October 2021

Important information

The research and analysis included on this website has been produced by Columbia Threadneedle Investments for its own investment management activities, may have been acted upon prior to publication and is made available here incidentally. Any opinions expressed are made as at the date of publication but are subject to change without notice and should not be seen as investment advice. Information obtained from external sources is believed to be reliable but its accuracy or completeness cannot be guaranteed.

Related Insights

30 September 2024

Steven Bell

Chief Economist, EMEA

Will £ Hit $1.50 in 2025?

Signs indicate sterling’s ascent has begun in earnest. How soon before it reaches $1.50?
Watch time - 4 min
23 September 2024

Steven Bell

Chief Economist, EMEA

Will the £22bn black hole suck the UK back into recession?

Are fears for the UK economy overdone? We think so and here’s why.
Watch time - 4 min
18 September 2024

Steven Bell

Chief Economist, EMEA

Recession, inflation, and interest rates cuts: what does it all mean for markets?

Exploring the factors that mean we’re arguing the case for a goldilocks scenario of growth, easing inflation and lower rates.
Read time - 7 min
2 October 2024

Natalia Luna

Senior Thematic Investment Analyst, Global Research

Pauline Grange

Portfolio Manager

US election: the Inflation Reduction Act (IRA) and the risk of repeal - Implications for investors

The multi decade transition to green energy should remain intact. We explain why and highlight companies set to benefit.
Watch time - 10 mins
30 September 2024

Fixed Income Desk

In Credit - Weekly Snapshot

In Credit Weekly Snapshot – September 2024

Our fixed income team provide their weekly snapshot of market events.
30 September 2024

Steven Bell

Chief Economist, EMEA

Will £ Hit $1.50 in 2025?

Signs indicate sterling’s ascent has begun in earnest. How soon before it reaches $1.50?
Watch time - 4 min
true
true

Important information

The research and analysis included on this website has been produced by Columbia Threadneedle Investments for its own investment management activities, may have been acted upon prior to publication and is made available here incidentally. Any opinions expressed are made as at the date of publication but are subject to change without notice and should not be seen as investment advice. Information obtained from external sources is believed to be reliable but its accuracy or completeness cannot be guaranteed.

You may also like

Investment approach

Teamwork defines us and is fundamental to our investment approach, which is structured to facilitate the generation, assessment and implementation of good, strong investment ideas for our portfolios.

Funds and Prices

Columbia Threadneedle Investments has a comprehensive range of investment funds catering for a broad range of objectives.

Investment Capabilities

We offer a broad range of actively managed investment strategies and solutions covering global, regional and domestic markets and asset classes.

Thank you. You can now visit your preference centre to choose which insights you would like to receive by email.

To view and control which insights you receive from us by email, please visit your preference centre.

Woman listens to music through headphones
Play Video

CT Property Trust- Fund Manager Update

Sed ut perspiciatis unde omnis iste natus error sit voluptatem accusantium doloremque laudantium