Technological disruption has not only affected individual sectors, but the global equity index1 as a whole. However, looking purely at the Information Technology (IT) sector is misleading: MSCI changed the industry classifications at the end of September 2018, creating a Communications Services sector which integrated telecommunications, media and internet companies. This was ostensibly to reflect the evolution in the way people communicate and access entertainment content, but it also saw companies such as Alphabet, Facebook, Alibaba and Baidu shift out of the IT sector.

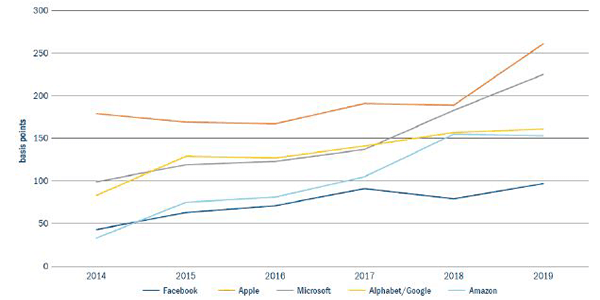
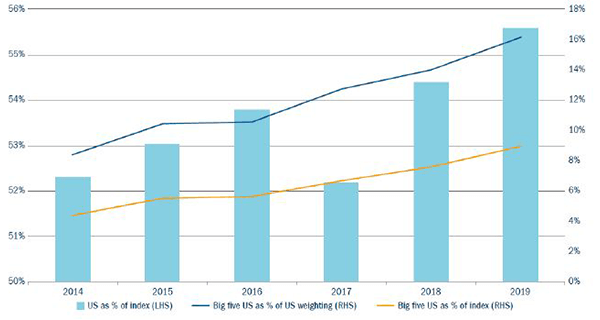
This allowed investors to own more of the “Big Tech”2 firms without breaching allocation limits to a single sector. It also likely helped accelerate the increase in the index weighting of Big Tech (Figure 1), which has gone from less than 5% of the index at the back end of 2014 to more than 10% at the end of 2019. While the US’s representation in the index has also climbed a few percentage points to 56%, the proportion of the big five US tech firms3 within this has gone from 8% to 16% 4. Typically, these companies pay low or no dividend payments, preferring to focus on acquiring market share, other companies or their own shares.

What is an income investor to do?
Historically we have had a singular focus on dividends, but this has led to an increasing proportion of our risk budget being driven by what we can’t own due to the shifting sands of the index. Consequently, we think focusing on shareholder yield, which incorporates share buybacks as well as dividends, improves the opportunity set in terms of sector and regional breakdown, and allows us to reduce the structural risks that have arisen over time and accelerated in 2019.
Therefore, rather than only investing in companies with a dividend yield above that of the index, we shall now target those with both a dividend yield of more than 1% – we are an income fund after all! – and a shareholder yield greater than the dividend yield on the index. In other words, we are looking for the same level of capital return from the companies in which we invest but acknowledge the different means through which this can be done.

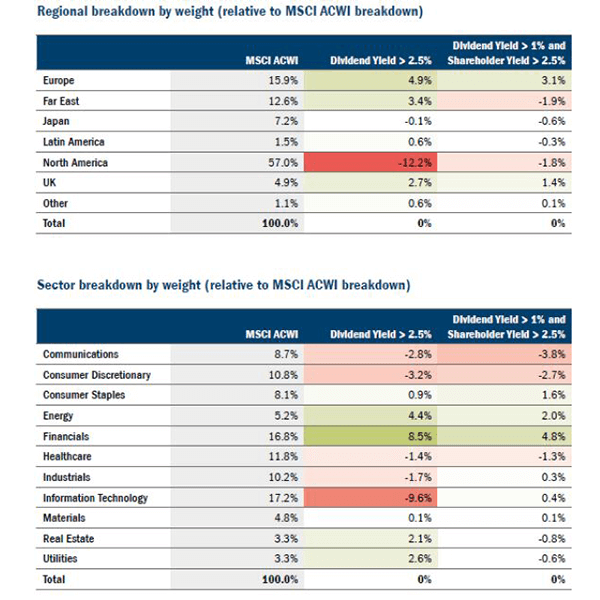
Figure 3 demonstrates the impact. The opportunity set now more closely resembles our index, with the 12.2% underweight to North America dropping to just 1.8% and the IT exposure comparable to that of the index. At a stock level, that’s a 30% increase in North American names to 331 against an index of 709. Further, it boosts the number of names available in the IT sector by around 50% to 108, while Healthcare increases by more than 40% to 48.
What outcome does this have for portfolios?
Our underlying philosophy is unchanged. We focus on consistent and wise capital allocation; this remains the case, but we will now be incorporating regular share repurchases into our capital return metrics. We will still seek high dividend yields and will not be buying zero or minimal dividend yield stocks. The rest is unchanged in terms of growth and sustainability of capital return, but we have the flexibility to mitigate the structural risks that have built over time and accelerated in 2019.
We recognise the index has shifted over time and believe that focusing on shareholder yield, which incorporates share repurchases as well as dividends, enables income investors to better build a balanced and diversified portfolio of stocks that provide both a high income and a competitive risk-adjusted return versus the index. the structural risks that have built over time and accelerated in 2019.


